


.png)

L2 Weekly Stock Market News Analysis
January 25th, 2025

TLDR:
Markets head into the new week with policy and liquidity risks outweighing traditional macro data. Yen volatility has re-emerged as a key global driver, with renewed instability in Japan tightening liquidity and pressuring risk assets. Crypto has moved first once again, with Bitcoin down sharply on the week — a familiar signal that funding conditions are deteriorating beneath the surface.
At the same time, Washington is adding a domestic layer of uncertainty. While most government funding bills have broad bipartisan support, disagreements over Homeland Security funding have stalled progress. Monday’s scheduled Senate vote was canceled, compressing the timeline ahead of the January 30 deadline. Betting markets are now pricing a 79% probability of a government shutdown, raising headline risk even if the ultimate economic impact proves limited.
Geopolitically, President Trump announced that the U.S. has reached a preliminary framework agreement with Greenland, dialing back earlier tensions and easing some trade-related uncertainty tied to Arctic access and strategic resources. While details remain sparse, the announcement helped stabilize sentiment at the margin.
Equity performance reflected a defensive and selective rotation rather than broad risk-on behavior. Consumer Staples and Utilities led as investors leaned toward earnings stability, while Industrials and Materials advanced on defense, infrastructure, and critical-minerals exposure. Energy also gained amid geopolitical undercurrents. In contrast, Technology participation was muted, Consumer Discretionary lagged, and Financials underperformed following earnings disappointments — signaling caution rather than panic as multiple macro stress points converge.
What’s happening now: Japan is defending the yen as volatility rises
Japan’s currency problems have escalated from concern to action because the yen fell back toward levels that, in the past, forced officials to step in. Around the ¥159–¥160 per dollar area, markets generally assume Japan will not tolerate further weakness, since previous episodes at those levels led to official intervention.
As the yen slid toward that zone again, Japanese authorities took an unusual step: they asked the U.S. Treasury for help. In response, the U.S. Treasury instructed the New York Federal Reserve to conduct “rate checks” in the yen–dollar market. A rate check is not an intervention by itself — no money is spent and no trades are executed — but it is a deliberate signal. It tells banks and traders that authorities are actively monitoring the market and are preparing, if necessary, to step in and buy yen or sell dollars.
Markets treat this as a warning because rate checks almost never happen unless policymakers believe the move has become disorderly. The last time the U.S. and Japan coordinated in this way was during periods of acute stress, such as after Japan’s 2011 earthquake. That history is why the yen jumped immediately once the rate checks became known: traders understood that officials were drawing a line and that betting against the yen now carries much higher risk.
In short, this wasn’t a routine comment or verbal reassurance. It was a concrete signal that Japan’s currency weakness has become serious enough to trigger coordination with the U.S. — a step that usually comes before direct intervention, not after.

Why this matters globally: how the yen quietly drives risk markets
Back in November, we flagged Japan as a global risk point not because of trade or growth, but because of how capital moves through the financial system.
For decades, the yen has been one of the cheapest currencies to borrow. Investors would borrow yen at very low rates, convert it into dollars, and use that money to buy riskier assets like U.S. stocks and crypto. This worked as long as the yen stayed weak or stable.
When the yen strengthens suddenly — or becomes unstable — that trade starts to break. Borrowed yen become more expensive to repay, forcing investors to sell assets quickly to reduce exposure. That’s why Japan has an outsized impact on global markets: sharp yen moves effectively tighten global liquidity.
If direct intervention occurs, this process speeds up. Intervention tends to create abrupt, uneven currency moves rather than gradual shifts. Those fast jumps leave investors little time to adjust, triggering rapid unwinds in positions funded with cheap yen.
We’ve seen this pattern repeatedly:
- In August 2024, a yen carry-trade unwind preceded a broader selloff, with QQQ falling nearly 10% in two weeks.
- In November 2025, renewed stress in Japan appeared first in crypto before spreading to other risk assets.
- Now, as yen volatility returns, Bitcoin is down nearly 3% today and about 9.5% on the week, once again reacting first.
Crypto tends to move first because it sits closest to global liquidity. When funding conditions tighten, it reprices immediately — before earnings, data, or headlines catch up.

What the chart above shows: when the yen strengthens, short-term U.S. market volatility rises alongside it. Since mid-2024, swings in Japan’s currency have closely tracked spikes in equity stress, reinforcing the yen’s role as an early warning signal.
That’s why the current setup matters. Japan has shifted from a background vulnerability to an active trigger. With officials openly signaling intervention and the yen snapping higher, the same liquidity dynamic we flagged months ago is now playing out in real time.
If this pressure persists, the most exposed U.S. stocks are those that benefited most from easy global funding:
- High-valuation tech and AI leaders such as NVIDIA, AMD, Broadcom, Microsoft, and Alphabet.
- Crypto-linked equities including Coinbase, MicroStrategy, Marathon Digital, and Riot Platforms.
- Japan-linked U.S. proxies, such as SoftBank’s ADR and Japan-focused ETFs like the iShares MSCI Japan ETF.
Japan hasn’t broken — but it’s no longer quietly absorbing stress. And when the world’s largest source of cheap funding starts to wobble, markets tend to notice quickly.

Another near-term risk: a possible U.S. government shutdown
Alongside global currency stress, markets are also watching Washington as the January 30 funding deadline approaches.
On substance, there is broad bipartisan agreement on most of the funding bills. A package covering major agencies — including Defense, Transportation, Health, Education, and Housing — has already been negotiated, and leaders from both parties have said they want to avoid a shutdown.
The uncertainty now centers on Homeland Security funding. Senate Democrats, led by Chuck Schumer, have said they will block any package that includes DHS funding without changes, while Republicans argue DHS should be funded alongside the broader government. Both sides continue to signal a desire to avoid a shutdown, but the disagreement has slowed progress.
Compounding the issue, Monday’s scheduled Senate vote was canceled, compressing an already tight timeline. With only days left before the funding deadline, procedural delays — rather than policy disagreements — are becoming the primary risk.
That shift is starting to show up in markets. Betting markets now imply roughly a 79% chance of at least a partial government shutdown, reflecting concern that timing and process, not political intent, could push negotiations past the deadline.
From a market perspective, this matters less for direct economic damage — past shutdowns often saw limited or short-lived market impact — and more for uncertainty and sentiment, especially when layered on top of existing macro and policy stress.
Which stocks tend to feel it most
Most pressured
- Energy & cyclicals
Occidental Petroleum (OXY), Exxon Mobil (XOM), Chevron (CVX) - Financials, especially regional banks and insurers
PNC Financial (PNC), KeyCorp (KEY), Fifth Third Bancorp (FITB), Progressive (PGR), Allstate (ALL) - Communications & ad-sensitive media
News Corp (NWSA), Warner Bros. Discovery (WBD), Paramount Global (PARA) - Government-contract names sensitive to payment timing
Boeing (BA), Lockheed Martin (LMT), General Dynamics (GD)
More resilient
- Defensive sectors with steady demand
Procter & Gamble (PG), PepsiCo (PEP), Johnson & Johnson (JNJ), UnitedHealth Group (UNH) - Mega-cap tech, where earnings visibility and balance sheets matter most
Microsoft (MSFT), Apple (AAPL), Alphabet (GOOGL), Amazon (AMZN), NVIDIA (NVDA)

Trump’s Greenland Framework: Why Critical Minerals Are the Real Prize
The emerging Greenland framework deal marks a clear shift from confrontation to negotiation. After weeks of tension, President Trump announced a preliminary agreement with NATO leadership that drops tariff threats and military rhetoric in favor of expanded U.S. access and cooperation. Treasury Secretary Scott Bessent described the deal as “much more fulsome for the United States” than past arrangements — signaling that this goes well beyond legacy defense access from the Cold War era.
While details remain limited, the strategic logic is straightforward. Greenland sits atop one of the world’s richest untapped stores of critical minerals, with 25 of the EU’s 34 designated critical raw materials present, including rare earth elements, graphite, niobium, titanium, and uranium. For the Trump administration, the priority is twofold: secure supply chains for U.S. industry and defense, and block China and Russia from gaining a foothold in the Arctic. This fits squarely with the broader “America First” push to localize or ally-shore resource production critical to energy, AI, defense, and advanced manufacturing.
Importantly, this is about access and influence, not formal ownership. Mining Greenland remains difficult — harsh climate, limited infrastructure, and high costs — but warming temperatures, new shipping routes, and U.S. financial backing (including prior Export-Import Bank support for mining projects) are slowly changing the economics.
U.S.-Listed Rare Earth & Critical Minerals Stocks to Watch
Rare Earths (REEs)
- MP — MP Materials
- USAR — USA Rare Earth
- TMRC — Texas Mineral Resources
- CRML — Critical Metals Corp
Multi-Critical / Strategic Metals
- UAMY — United States Antimony
- NB — NioCorp Developments
- AREC — American Resources
- IPX — IperionX
Graphite
- NVX — Novonix
- NMG — Nouveau Monde Graphite
- WWR — Westwater Resources
Uranium
- LEU — Centrus Energy
- URG — Ur-Energy
- UEC — Uranium Energy Corp
- CCJ — Cameco
Copper & Battery Metals (Downstream Beneficiaries)
- TMQ — Trilogy Metals
- FCX — Freeport-McMoRan
- ALB — Albemarle
- LAC — Lithium Americas
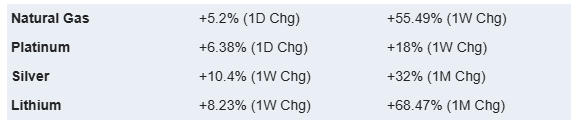
Last's Weeks Sector Winners & Losers
Sector performance was mixed, with modest gains in Energy and Materials offset by broad weakness in rate-sensitive and defensive areas. Leadership was narrow rather than indicative of a full risk-on move.
Energy (XLE) led the market, rising +2.73%, supported by geopolitical positioning and ongoing focus on Western Hemisphere energy security. Materials (XLB) gained +1.14%, reflecting continued interest in commodities and critical-minerals exposure. Health Care (XLV) also edged higher (+0.85%), offering limited defensive support.
Most other sectors were flat to lower. Communication Services (XLC) finished essentially unchanged (+0.03%), while Consumer Discretionary (XLY) (–0.07%) and Consumer Staples (XLP) (–0.12%) showed little conviction in either direction. Industrials (XLI) slipped –0.17%, suggesting pause rather than reversal in infrastructure and manufacturing momentum.
Rate-sensitive sectors underperformed. Information Technology (XLK) declined –0.40%, signaling selective profit-taking in growth. Financials (XLF) fell –1.03%, pressured by earnings uncertainty and tighter credit conditions. Real Estate (XLRE) dropped –1.34%, and Utilities (XLU) were the weakest group (–2.06%), reflecting continued sensitivity to rates and funding costs.

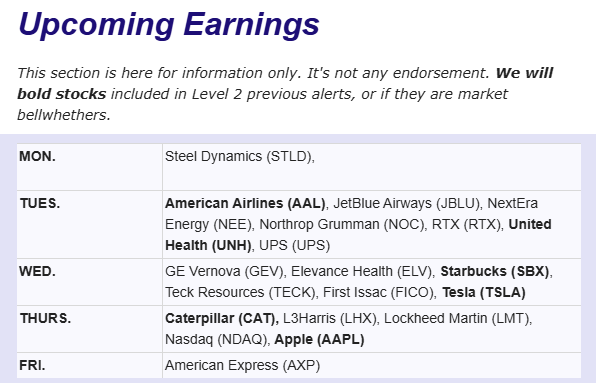
Upcoming Events This Week
The final week of January is set to be a major inflection point for markets, combining heavyweight earnings, central bank decisions, and key global data releases. The Federal Reserve will deliver its first policy decision of the year, with rates expected to remain unchanged at 3.5%–3.75%, but markets will be focused on guidance amid growing divergence among FOMC members and the possibility that a successor to Chair Jerome Powell could be announced soon. Earnings season accelerates sharply, led by Apple, Microsoft, and Meta, whose results will provide fresh insight into AI demand and data-center investment, alongside reports from major players across technology, finance, healthcare, industrials, and energy. On the data front, U.S. releases include durable goods orders and producer prices, while globally investors will watch GDP figures from the Eurozone and Canada, inflation data from Germany, Spain, and Australia, China’s first official PMI readings of the year, and rate decisions from central banks in Canada, Brazil, and Sweden.


Company News
LevelFields AI Stock Alerts Last Week
- BankUnited, Inc. (BKU) +8.5% on $200M Share Repurchase Authorization
- BankUnited shares jumped 8.5% in a single session after the company authorized an additional $200 million share repurchase program—roughly 7% of its market capitalization. The buyback underscores management confidence in capital strength and earnings durability, particularly as regional banks navigate tighter credit conditions. With a sizable authorization relative to market cap, the move improves capital return visibility and supports near-term share price dynamics through reduced float and enhanced EPS leverage.
- Intel (INTC) — The comeback trade ran into reality
Intel had become one of the market’s biggest “turnaround” stories heading into earnings. The stock was up sharply going into the print as investors latched onto a simple narrative: the U.S. government support, renewed optimism around traditional server chips powering AI data centers, and the first visible progress on Intel’s next-generation manufacturing (18A / Panther Lake) meant the recovery was finally clean and accelerating.
Earnings reminded the market it’s not clean — and it’s not linear.
Intel’s quarter was solid enough, but the outlook wasn’t. Management signaled that near-term results will be constrained by internal supply limits in its own factories, meaning Intel can’t fully capitalize on demand right now even if customers want more chips. That matters because Intel is trying to prove two things at once: that its products are competitive again, and that its manufacturing machine can reliably deliver. Supply constraints undercut both.
The other issue is strategic: Intel’s core CPU business is still losing ground to AMD and Arm, and its foundry ambitions still need a big outside customer to justify the cost base. Without meaningful external foundry wins, Intel is effectively funding a massive manufacturing rebuild while its product unit fights to stabilize share — a difficult combination when guidance is already soft.
Bottom line: Intel didn’t blow up, but it also didn’t deliver the “perfect” report the stock had priced in after a huge run. The market is now shifting from hype to hard questions: can Intel execute consistently, ramp supply, and win real outside foundry customers — fast enough to make the turnaround durable?
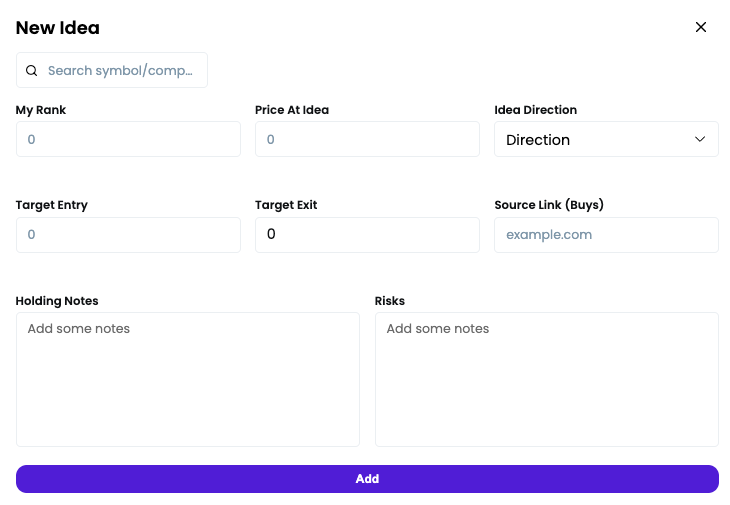
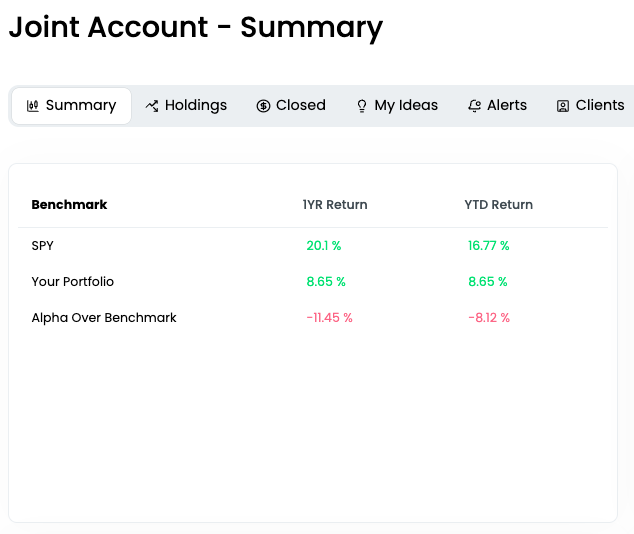
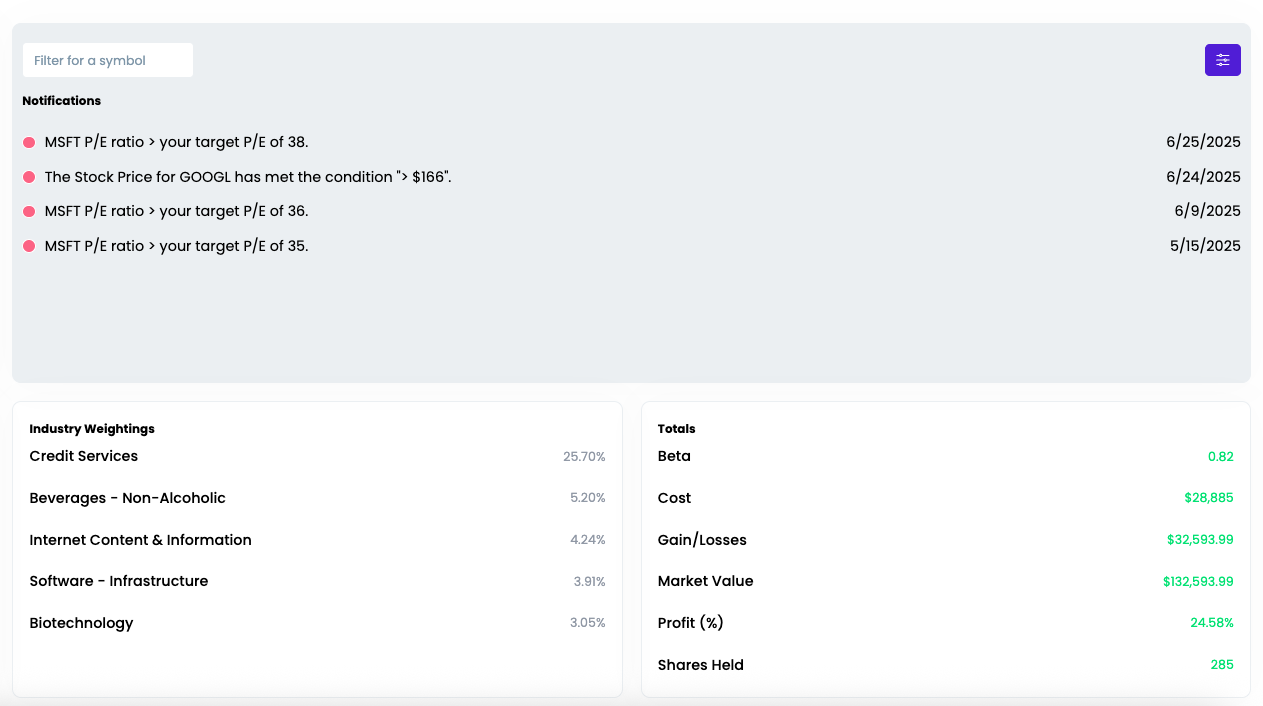
Introducing the LevelFields Portfolio Tracker
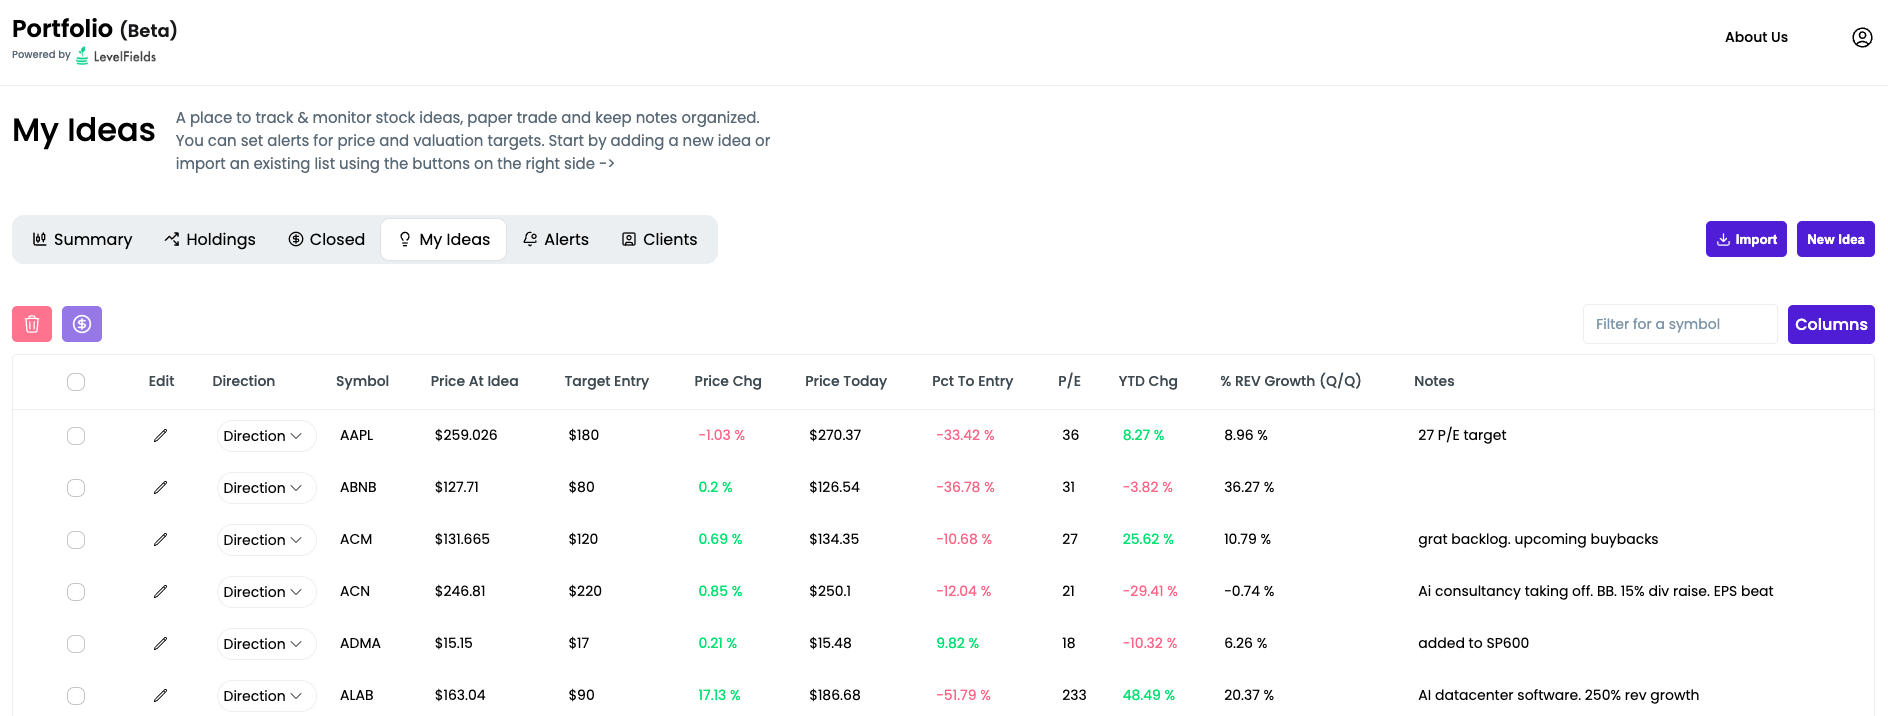
We’ve just launched the new LevelFields Portfolio platform — a centralized dashboard built for active investors and wealth managers to track their trades, organize trade ideas, and monitor real or prospective portfolios.
We've replaced Excel and Google Sheets trade tracking with software that updates as prices and valuations of stocks change, so you don't lose money by missing great entry and exit points.
You can sign up for free!
What it does:
- Lets you add both real positions and idea-stage trades into one unified portfolio.
- Tracks allocation, profit/loss, KPIs, P/E, price targets, and thesis notes in one place.
- Allows you to set real-time alerts on valuation changes, price moves, and price targets using bulk editing (e.g. one alert for all holdings).
- Lets you toggle any ticker between “Idea → Holding → Closed” while preserving the original trade thesis and exit notes.
- Designed for traders, advisors, and fund managers who need a live, organized view of positions + rationale, not just a static spreadsheet of tickers.
- Import CSV file of existing ideas, notes, and portfolio holdings for a quick start
- Keep track of reasons you bought and sold to analyze your performance and for compliance
- Design your own model portfolios based on allocations, sector, and industry
.png)
How to use LevelFields for Options Trading
Tracking Stocks Without Spreadsheets
The Truth About Dividend Stocks
What's LevelFields' Premium Membership Provide?
This is not financial advice. All information represent opinions only for informational purposes. Given the vast number of stocks we cover in these reports, assume staff covering stocks have positions in stocks discussed.
Have feedback or a request for specific data? Drop us a note at support@levelfields.org