


.png)

L2 Weekly Stock Market News Analysis
February 8th, 2026

TLDR:
Markets head into mid-February with last week’s action reflecting rotation, not relief. Sector leadership shifted away from crowded growth areas and toward steadier, real-economy exposure. Consumer Staples (XLP) led, up +5.30%, as investors favored consistent demand and pricing stability. Industrials (XLI) gained +4.68% on infrastructure and non-tech capital spending, Materials (XLB) rose +4.55% on physical production and supply-chain rebuilding, and Energy (XLE) advanced +4.31% as energy security moved back into focus. Defensive participation was selective rather than panicked, with Health Care (XLV) +1.92%, Financials (XLF) +1.53%, Real Estate (XLRE) +1.35%, and Utilities (XLU) +0.23%.
Earlier in the week, markets were pressured by forced selling in high-risk areas, particularly crypto, where leverage unwound rapidly and liquidity thinned. That episode didn’t dictate where money flowed afterward, but it set a cautious tone, reinforcing risk limits and reducing appetite for crowded trades. As volatility rose, investors became more selective rather than broadly risk-seeking.
That caution showed up most clearly in growth-heavy sectors. Information Technology (XLK) fell –1.91%, Consumer Discretionary (XLY) declined –2.62%, and Communication Services (XLC dropped –3.60%), reflecting continued pressure on areas with stretched positioning and higher sensitivity to earnings uncertainty. Software remained a focal point as investors reassessed how quickly AI tools could affect future growth, adding to near-term hesitation rather than triggering outright panic.
By the end of the week, selling pressure eased and prices rebounded, but the setup still looks fragile. Positioning remains tight, cash levels are not elevated, and earlier dip-buying behavior was limited. The result is a market that can bounce — but one where leadership favors stability over momentum, and where confidence remains conditional rather than restored.
The selloff accelerated — early warnings turned into broad pressure
Last week’s selloff began outside traditional equities, with crypto, gold, and silver seeing sharp declines first. Stocks were already under pressure at that point, but those early moves mattered because they signaled that liquidity and risk appetite were deteriorating faster than equity prices alone suggested.
That warning intensified this week.
As selling continued, pressure spread more forcefully into equities, with software and technology absorbing the heaviest losses. Bitcoin fell as low as ~$60,000 — down roughly 20% over the past month — and stocks moved lower alongside it. Software and services companies alone lost roughly $830 billion in market value in six trading days, marking the sector’s worst drawdown since 2022. Dip-buying, which had repeatedly stabilized prior tech pullbacks, was largely absent.
This wasn’t driven by a single headline or a sudden break in economic data. It was the result of crowded positioning unwinding across multiple asset classes at once, with losses feeding into each other rather than staying isolated.

Forced selling took over — starting in crypto
What turned steady pressure into a sharp selloff was forced liquidation, beginning in crypto and then accelerating rapidly.
In the span of a week, roughly $500 billion was wiped from the crypto market as leverage finally snapped. Bitcoin fell from around $80,000 to near $60,000, at one point dropping 15% in a single day, while Ethereum fell more than 30%, briefly slipping below $1,800. Overall market value sank toward $2 trillion, and more than $2.5 billion in leveraged derivatives positions were liquidated, underscoring how much of the move was driven by forced selling rather than discretionary exits.
That pressure was highly concentrated in time. Over just 24 hours, more than $1.45 billion in crypto positions were liquidated, wiping out over 300,000 traders, with long positions accounting for the vast majority of losses. Bitcoin alone made up roughly $740 million of those liquidations. Once key price levels broke, selling cascaded quickly as liquidity vanished across exchanges.
That same dynamic then spilled into other markets. Investors weren’t selling because their outlook suddenly changed — they were selling because risk limits, leverage, and internal rules forced them to. As prices fell, buyers stepped back. Retail participation faded, institutions were net sellers, and prices dropped faster simply because there was no one on the other side of the trade.
Why the selloff spread — crowding, AI fears, and no buyers
Once selling moved beyond crypto, crowding made everything worse. Too many investors — hedge funds, retail traders, and systematic strategies — were positioned in the same areas: AI, semiconductors, momentum stocks, metals, and retail favorites. According to Morgan Stanley’s quant team, markets experienced a momentum shock, where stocks that had been rising together suddenly started falling together. When those trades turned, selling wasn’t gradual — it was automatic.
At the same time, AI uncertainty amplified the damage in software stocks. Recent releases of task-executing AI tools — such as Anthropic’s Claude agent and legal productivity plug-ins — showed how quickly AI is moving into core software functions like legal research, data analysis, coding, and enterprise workflows. That raised credible questions about how soon parts of the software industry could face disruption, widening the range of possible outcomes for future earnings.
That uncertainty forced investors to reassess valuations all at once rather than gradually, hitting a sector that was already crowded and heavily owned. The pressure was compounded by software’s deep ties to private credit, where falling equity values raised concerns about financing and credit quality, feeding back into even more selling.
The problem wasn’t just heavy selling — it was the absence of buyers. Retail investors, who had aggressively bought dips earlier in the year, barely showed up. Retail demand fell near the bottom of its historical range, while institutions were supplying stock. With no marginal buyer stepping in, even modest selling pressure pushed prices sharply lower.
This was especially visible in momentum-heavy areas. Some of the most crowded momentum trades suffered their sharpest one-day drops in years, driven almost entirely by investors unwinding long positions. Historically, when selloffs are led by longs being cut — rather than shorts covering — weakness tends to last weeks, not days.
Mechanical selling added fuel to the fire. Leveraged ETFs were forced to rebalance, dumping an estimated $18 billion of U.S. equities in a single day, much of it concentrated in tech and semiconductors. The same crowding showed up in precious metals, where gold and silver positions were unwound aggressively after prices rolled over.
Put simply, this wasn’t a clean reset. Selling relieved some pressure, but positioning remains crowded and cash levels are still low. That’s why sharp bounces are possible — but also why they may struggle to hold. Until positions are meaningfully reduced and buyers return in size, markets remain vulnerable to sudden air pockets like the one we just saw.

Rotation out of AI and into steadier parts of the market
As selling hit tech and other crowded AI trades, money didn’t leave the market — it rotated. Investors pulled back from parts of tech where expectations had become stretched and shifted capital into sectors with steadier demand and clearer near-term earnings.
Sectors that rose over the past 5 days:
- Consumer Staples (XLP): +5.3%
- Industrials (XLI): +4.7%
- Materials (XLB): +4.6%
- Energy (XLE): +4.3%
- Health Care (XLV): +1.9%
- Financials (XLF): +1.5%
- Real Estate (XLRE): +1.3%
- Utilities (XLU): +0.2%
Why this happened
The AI trade ran into a reality check during earnings. Several large tech companies reported solid demand but paired it with much higher spending plans, which forced investors to rethink how soon those AI investments will translate into profits.
- Alphabet (-3.9% 1 Week Performance) guided to $175–$185B in 2026 capital spending, nearly double 2025 levels.
- Amazon (-12% 1 Week Performance) guided to roughly $200B in 2026 capital spending, about 50% higher than last year, while also missing on earnings and offering weaker guidance.


That combination — higher costs and longer payback periods — made some of the most crowded AI and software names less attractive in the near term.
As a result, investors moved toward sectors where demand is more predictable and less dependent on long-dated growth assumptions. Staples, health care, energy, materials, and industrials benefited as capital shifted toward businesses tied to everyday consumption, infrastructure, and physical production rather than future AI payoffs.
Last's Weeks Sector Winners & Losers
Sector performance was sharply divided, with gains concentrated in defensive and real-economy areas while growth-oriented sectors lagged.
Consumer Staples (XLP) led the market, rising +5.30%, as investors rotated toward steady demand and pricing stability amid volatility. Industrials (XLI) followed closely, up +4.68%, supported by infrastructure exposure and expectations of continued capital spending outside of tech. Materials (XLB) gained +4.55%, benefiting from demand tied to physical production and supply-chain rebuilding, while Energy (XLE) advanced +4.31% on renewed focus on energy security and supply constraints.
More defensive sectors also posted gains. Health Care (XLV) rose +1.92%, Financials (XLF) added +1.53%, and Real Estate (XLRE) gained +1.35%, reflecting selective positioning rather than broad risk-taking. Utilities (XLU) edged higher by +0.23%, signaling modest defensive interest without a full flight to safety.
On the downside, weakness was concentrated in growth-heavy areas. Information Technology (XLK) fell –1.91%, Consumer Discretionary (XLY) declined –2.62%, and Communication Services (XLC) dropped –3.60%, highlighting continued pressure on sectors most exposed to stretched valuations, AI-related uncertainty, and shifting earnings expectations.

Upcoming Events This Week
The week of February 9 will be unusually important for U.S. markets due to a backlog of delayed economic data from the partial government shutdown. Both the January jobs report and CPI will be released in the same week, directly impacting expectations around the Federal Reserve’s next policy moves. Nonfarm payrolls are expected to rise by 70,000 after December’s 50,000 gain, with the unemployment rate holding at 4.4%. Wage growth is projected to slow to 3.6% year over year, while CPI is expected to rise 0.3% month over month, with core inflation also forecast at 0.3%.
Beyond inflation and jobs, investors will also watch December retail sales, expected to increase 0.5%, along with existing home sales, the Employment Cost Index, trade prices, business inventories, and January’s budget statement. Federal Reserve commentary will be closely followed for clues on how policymakers interpret the data. Corporate earnings remain a major focus as well, with results due from McDonald’s, Coca-Cola, Cisco, Applied Materials, and a broad slate of technology, healthcare, and consumer companies, keeping volatility elevated across both macro and equity markets.


Company News
LevelFields AI Stock Alerts Last Week
Mitek Systems (MITK) +20% — Stock Buyback Authorization
Mitek shares jumped 20% in a single session after the company authorized a new $50 million share repurchase program, equal to roughly 10% of its market capitalization. The move signaled confidence in cash generation and balance-sheet strength, while meaningfully reducing share supply and supporting earnings per share.
Powell Industries (POWL) +16% — Dividend Increase
Powell Industries rallied 16% after announcing an increase in its quarterly cash dividend to $0.27 per share, lifting the annualized payout to $1.08. The increase reinforced confidence in cash flow durability and highlighted Powell’s positioning across energy, utility, and industrial electrical infrastructure markets.
Amazon — Strong cloud demand, but investors panicked because spending is exploding
Amazon’s quarter had a split personality: parts of the business looked solid, but the overall report didn’t feel “clean.” Earnings came in just under expectations ($1.95 vs. $1.96), and while total sales beat estimates ($213.39B vs. $211.49B), there were enough small misses (like third-party seller services and physical stores) to make investors less forgiving.
The bright spot was AWS. Cloud revenue was $35.58B (ahead of expectations) and grew 24% year over year, which was described as the fastest pace in three years. AWS profitability also held up, with segment margins rising to about 35%, reinforcing that demand for AI and cloud capacity is still real — and still growing.
What sank the stock wasn’t just the quarter — it was what Amazon said comes next. First-quarter sales guidance was merely okay ($173.5B–$178.5B, midpoint a bit light vs. expectations), but the real shock was the spending plan: Amazon said it expects to invest about $200B in 2026 capex, a 50% jump and far above what Wall Street was looking for. That tells investors Amazon is going “all in” on building out AI/data-center infrastructure — but it also raises two uncomfortable questions: how long until that spending turns into profits, and is there even enough electricity and grid capacity to power all the new data centers everyone wants to build?
So even with strong AWS growth, the market focused on the near-term hit to cash and the realism of the broader AI buildout. The result was immediate: Amazon dropped hard after hours, down as much as ~11%, because the message investors heard was simple — “we’re going to spend a lot more money before we make a lot more money.”
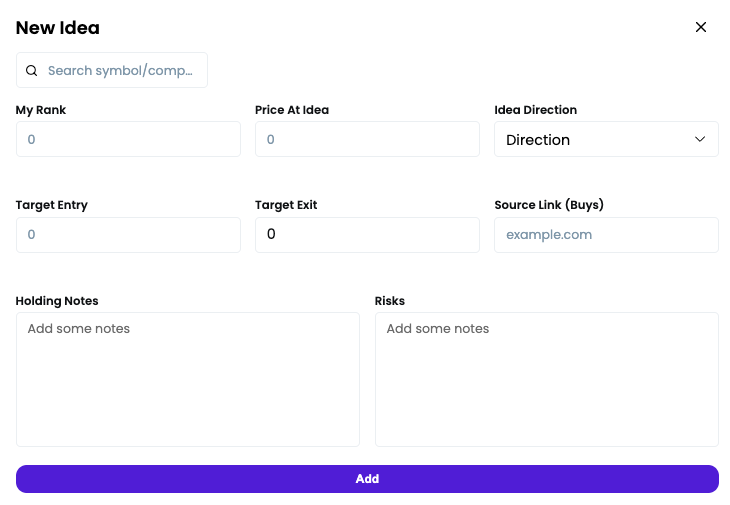
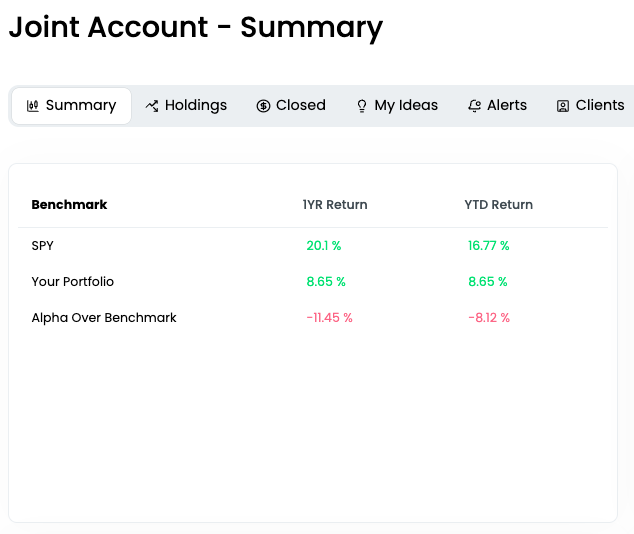
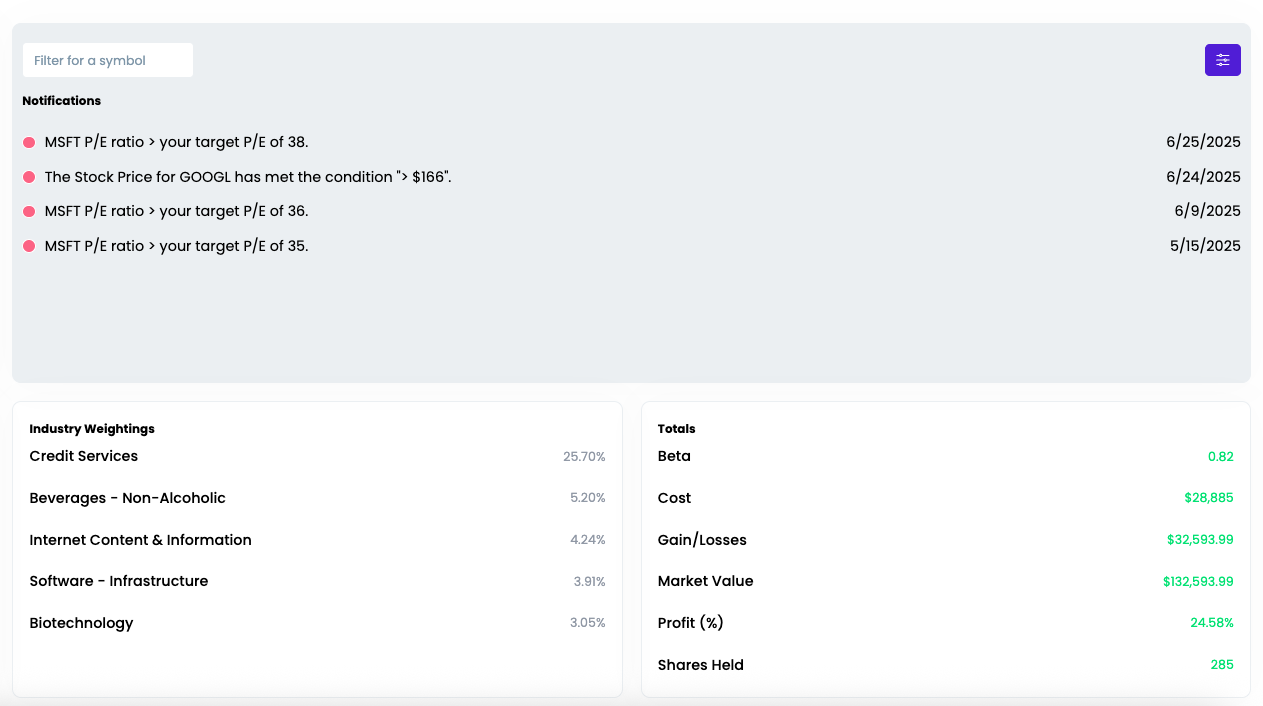
Introducing the LevelFields Portfolio Tracker
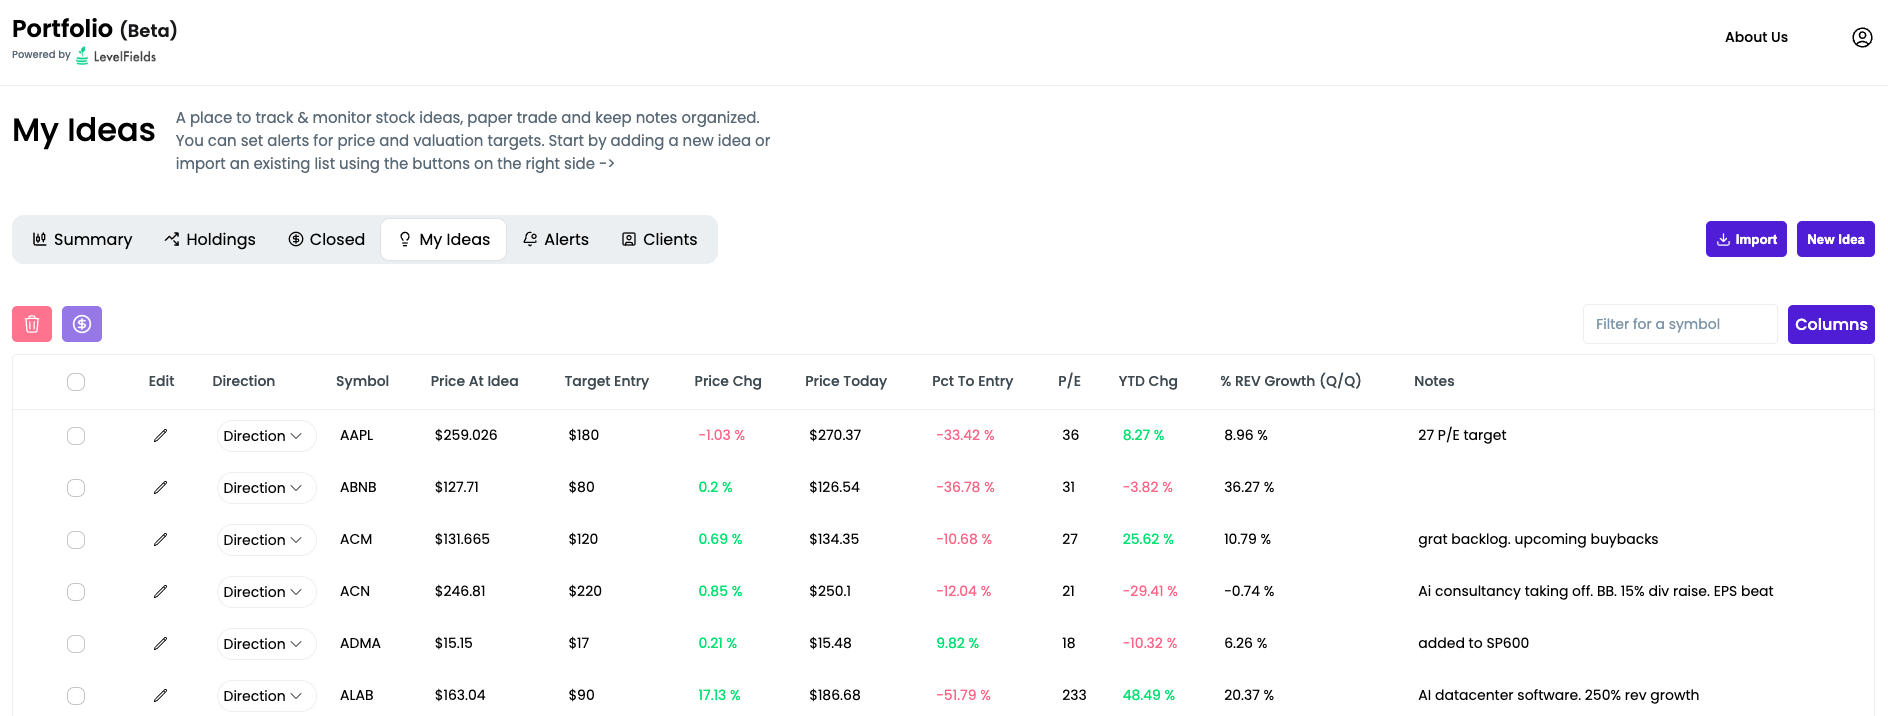
We’ve just launched the new LevelFields Portfolio platform — a centralized dashboard built for active investors and wealth managers to track their trades, organize trade ideas, and monitor real or prospective portfolios.
We've replaced Excel and Google Sheets trade tracking with software that updates as prices and valuations of stocks change, so you don't lose money by missing great entry and exit points.
You can sign up for free!
What it does:
- Lets you add both real positions and idea-stage trades into one unified portfolio.
- Tracks allocation, profit/loss, KPIs, P/E, price targets, and thesis notes in one place.
- Allows you to set real-time alerts on valuation changes, price moves, and price targets using bulk editing (e.g. one alert for all holdings).
- Lets you toggle any ticker between “Idea → Holding → Closed” while preserving the original trade thesis and exit notes.
- Designed for traders, advisors, and fund managers who need a live, organized view of positions + rationale, not just a static spreadsheet of tickers.
- Import CSV file of existing ideas, notes, and portfolio holdings for a quick start
- Keep track of reasons you bought and sold to analyze your performance and for compliance
- Design your own model portfolios based on allocations, sector, and industry

.png)
How to use LevelFields for Options Trading
Tracking Stocks Without Spreadsheets
The Truth About Dividend Stocks
What's LevelFields' Premium Membership Provide?
This is not financial advice. All information represent opinions only for informational purposes. Given the vast number of stocks we cover in these reports, assume staff covering stocks have positions in stocks discussed.
Have feedback or a request for specific data? Drop us a note at support@levelfields.org