


.png)

L2 Weekly Stock Market News Analysis
November 23rd, 2025

TLDR:
Stocks spent most of the week moving sideways, with sharp swings in both directions as traders tried to make sense of thin liquidity and conflicting economic signals. Markets continued to lean on hopes for a December rate cut, but Fed minutes showed a divided committee and no clear policy path, adding to the uncertainty.
The return of delayed government data after the shutdown only added noise. Investors were left with scattered indicators rather than a clear read on growth or inflation heading into the next Fed meeting.
At the same time, pressure in Japan’s bond and currency markets raised fresh concerns: a potential snap higher in the yen could force unwinds of the yen carry trade, tightening global liquidity and weighing most heavily on high-valuation U.S. tech and crypto-linked names.
With borrowing costs still elevated, pockets of credit stress emerging, and consumer strength showing early signs of cooling, investors rotated more cautiously. Defensive sectors drew steadier flows while momentum-driven areas struggled to find support.
Nvidia’s Big Quarter Meets a Market That’s Starting to Question Everything
Nvidia’s latest results were enormous — sharp revenue growth, data-center sales above $50B, and guidance that underscored just how large the AI buildout has become. In almost any other period, the stock would have lifted the entire market for days.
Instead, the rally faded within hours.
This was what we highlighted last week: the market is shifting out of the phase where AI excitement overshadowed everything, and into one where earnings are judged more closely and valuations carry more weight again. Nvidia delivered a beat, yet the market’s reaction showed investors are no longer chasing every AI headline. When expectations sit this high, even great results struggle to move stocks meaningfully.
This isn’t the end of the AI story — far from it — but it does mark a shift. The market is no longer moving on momentum alone, and selectivity matters again.
That shift showed up clearly in how money moved this week. Trading stayed jumpy, liquidity remained thin, and ETFs drove nearly 40% of all flows — amplifying every swing. And while Big Tech struggled, investors rotated aggressively into Healthcare, which saw some of its strongest inflows in months. Healthcare’s rebound has been building ever since the PFE/Trump deal, but this week’s strength pushed it to its highest level relative to Tech since May — capped by Eli Lilly becoming the first healthcare company ever to reach a $1 trillion market cap.
In other words: even as AI remains the long-term driver, investors are beginning to look for stability — not just the next headline.
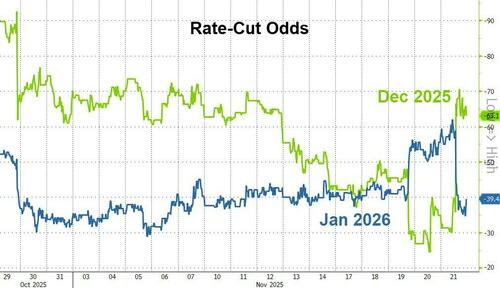
A Fragile Rally Held Up by Rate-Cut Hopes
Outside the AI sector, markets were choppy all week. Stocks drifted, liquidity was thin, and investors leaned heavily on the hope of a Fed rate cut in December. The only real support came when Fed officials hinted that easing might be justified.
Bonds captured the mood better than stocks. Yields fell across the board, especially in the 2-year, as traders doubled down on the idea of a near-term pivot. But when both stocks and yields fall at the same time, it usually reflects caution, not confidence.
The bigger picture hasn’t changed: borrowing costs remain high, credit stress is appearing in pockets of the economy, and consumers are slowing down. Those forces kept volatility high even as Friday's rebound grabbed attention.
A Fed Meeting That’s Getting Harder to Read
The upcoming Fed meeting has become more unpredictable. Newly released minutes showed many officials favored holding rates steady in December, while several supported a cut — a split that leaves the committee without a clear consensus. The latest jobs report didn’t settle things either: hiring improved modestly, but unemployment edged higher and wage growth softened, leaving the overall picture mixed.
Complicating matters is the government shutdown delay. The October and November employment reports won’t arrive until after the December meeting, meaning the Fed will have to make its decision without the usual set of data. That uncertainty is a key reason markets have been struggling to find direction.
The broader environment is also adding to the challenge. Recent market swings have interrupted months of steady optimism, and the drip of delayed economic releases has made it harder for investors to gauge momentum in real time. Rate expectations are still leaning toward early cuts, but they rest on assumptions that could shift quickly if incoming data surprises.
Looking further ahead, early 2026 may look different. Fiscal spending is expected to pick up, companies continue to invest heavily in AI-related infrastructure, and financial conditions remain easier than they were earlier in the year. Those forces could support growth next year — but for now, the path into the December meeting remains unusually murky.
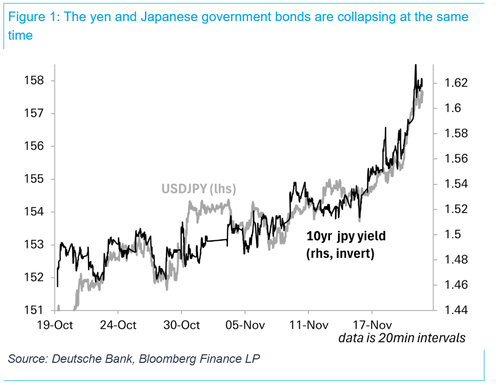
Japan Emerges as a New Global Risk Point
One major theme this week came from abroad: Japan’s bond market and currency weakening at the same time, something that historically happens only under deep macro stress.
Long-dated Japanese government bonds are on track for their worst year since the 1970s, while the yen hovers near multi-decade lows. Analysts warn that the combination of heavy fiscal stimulus, deeply negative real rates, and a fragile bond market could create a situation where policymakers are forced into abrupt moves.
Why does this matter for U.S. markets?
Because when Japan moves sharply, it affects global liquidity. Japanese funds are major investors in U.S. bonds and credit, holding roughly $3.62 trillion. If their domestic markets destabilize further, the global “carry” structure that has supported risk assets could unwind at the margins. It’s not a crisis today — but it’s a new pressure point investors have to monitor.
Japan’s Liquidity Valve Is Becoming a New Source of Market Risk
Japan moved back to center-stage this week — and for good reason. The combination of a weakening yen, rising Japanese bond yields, and a wave of highly leveraged retail currency trades has started to create the same pressure that triggered last year’s global selloff.
To understand why this matters, it helps to look at Japan’s role in the financial system.
Japan as a Global “Liquidity Valve”
For decades, Japan made it possible for global investors to borrow yen at extremely low interest rates — often near zero — and use that money to buy higher-yielding assets abroad. This is the classic yen carry trade, and it has been one of the largest sources of global liquidity over the past 25 years.
Here’s what the trade looks like in simple terms:
- Borrow in yen at 0%–1%
- Convert it to dollars
- Buy U.S. stocks, bonds, crypto, emerging-market currencies
- Pocket the difference
Because Japan kept rates near zero for so long — and even went negative for years — the world built up hundreds of billions of dollars of positions funded in yen. Many estimates put the size of the yen-funded global carry structure at $500 billion or more, spanning everything from Nasdaq exposure to EM bonds and crypto derivatives.
That cheap yen acted like a liquidity pump.
When the yen weakened, global money flowed into risk assets.
When the yen strengthened suddenly, the trades unwound — and markets fell.
What’s Happening Now
Three separate developments are now squeezing that valve:
- The yen has dropped to its weakest levels in nearly a year, forcing Japan’s finance minister to publicly warn about intervention — something officials almost never do.
- Japanese government bonds (JGBs) are under pressure, with long-dated bonds on track for their worst year since the 1970s.
- Japanese retail traders have piled into risky high-yield bets — especially the Turkish lira — with nearly 900,000 lira-yen margin contracts outstanding, close to an all-time high.
This is exactly the setup that causes trouble:
– a fragile currency,
– a stressed bond market,
– and heavy leverage sitting on top of both.
If Japan intervenes or signals a policy shift, the yen could snap higher. A sudden yen spike is the number one killer of carry trades because it forces investors to sell foreign assets quickly to cover losses at home.
Why This Looks Like Last Year — Only Bigger
In August 2024, a small 0.25% rate hike from the Bank of Japan was enough to knock the S&P 500 down 6% in a month. That happened when leverage was lower, Japan was more stable, and policy was far more predictable.
The basic setup hasn’t changed:
For decades, global investors borrowed yen at extremely low rates and used that cheap money to buy U.S. stocks, bonds, crypto, and emerging-market trades. When the yen suddenly rises — or Japan tightens policy — those positions lose money fast and investors are forced to sell.
What has changed is the scale of the pressure building now.
1. Japan’s long-term bond yields are hitting record highs.
The 20-year and 40-year bonds have been selling off sharply and are on track for their worst year since the 1970s.
2. The yen and long-term bonds are falling at the same time.
Deutsche Bank notes that both the currency and long bonds have dropped more than 5% in weeks. When a country’s currency and bonds break down together, it usually signals a loss of confidence at home — not just global volatility.
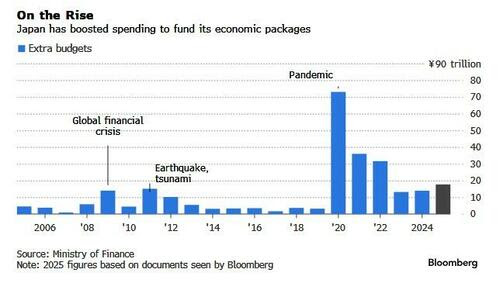
3. Japan is pushing forward a huge new spending package into a stressed bond market.
The government is preparing roughly ¥17.7 trillion ($112B) in new spending, with the total economic impact close to ¥42.8 trillion. But this comes as Japan’s debt sits near 230% of GDP, the highest of any major economy, and just after GDP shrank 1.8% last quarter.
Bond yields are rising because the market is signaling:
“We don’t want more debt at these levels.”
4. Retail traders in Japan are extremely leveraged.
Nearly 900,000 lira-yen margin contracts are outstanding — near an all-time high — because the trade offers over 30% annualized yields. If the yen jumps suddenly, these positions unwind violently.
5. Japan–China tensions are rising fast.
China is warning its citizens away from Japan, airlines are canceling flights, tourism stocks are falling, and diplomatic pressure is increasing. This adds another layer of stress on an already fragile economy.
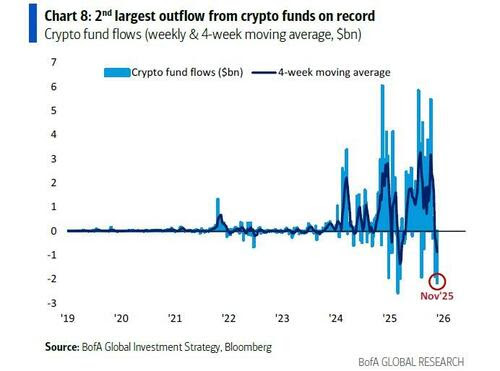
Crypto Is the First to React
The stress in Japan’s bond and currency markets showed up almost immediately in crypto — the asset class most sensitive to shifts in global liquidity.
As Japan’s long-term bond yields spiked and the yen dropped, traders rushed to pull back risk:
- Bitcoin fell below $83,000, helping wipe out roughly $1 trillion in crypto market value this month.
- More than $1.7 billion in crypto futures were liquidated in a single day as leveraged positions were forced out.
- Sentiment flipped sharply as traders recognized that the same forces hitting Japan — rising yields, currency instability, and political tension — could drain liquidity worldwide.
Crypto reacts first because it sits closest to global liquidity flows.
And with Japan’s bond market under pressure, a weakening yen, and rising geopolitical risk with China, one of the world’s biggest funding engines just became unstable.

What This Means for U.S. Markets
When Japan becomes unstable, global liquidity tightens, and the same U.S. sectors tend to feel it first.
1. High-Valuation Tech
AI, chip, and cloud names that benefited from yen-funded flows are the most sensitive to any shift in funding conditions.
Most exposed: NVDA, AMD, AVGO, SMCI, MSFT, GOOGL
2. Crypto-Linked Equities
Crypto trades move fastest when global liquidity wobbles, and a sharp yen move hits them immediately.
Most exposed: COIN, MARA, RIOT, MSTR
3. Japan-Linked U.S. Listings
These give direct exposure to Japan’s funding dynamics and tend to amplify moves when the carry trade is unstable.
Most exposed: SFTBY (SoftBank ADR), EWJ (Japan ETF)
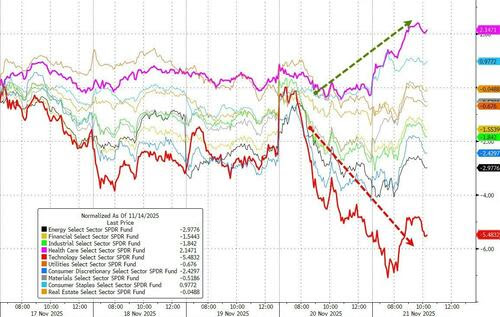
Last's Weeks Sector Winners & Losers
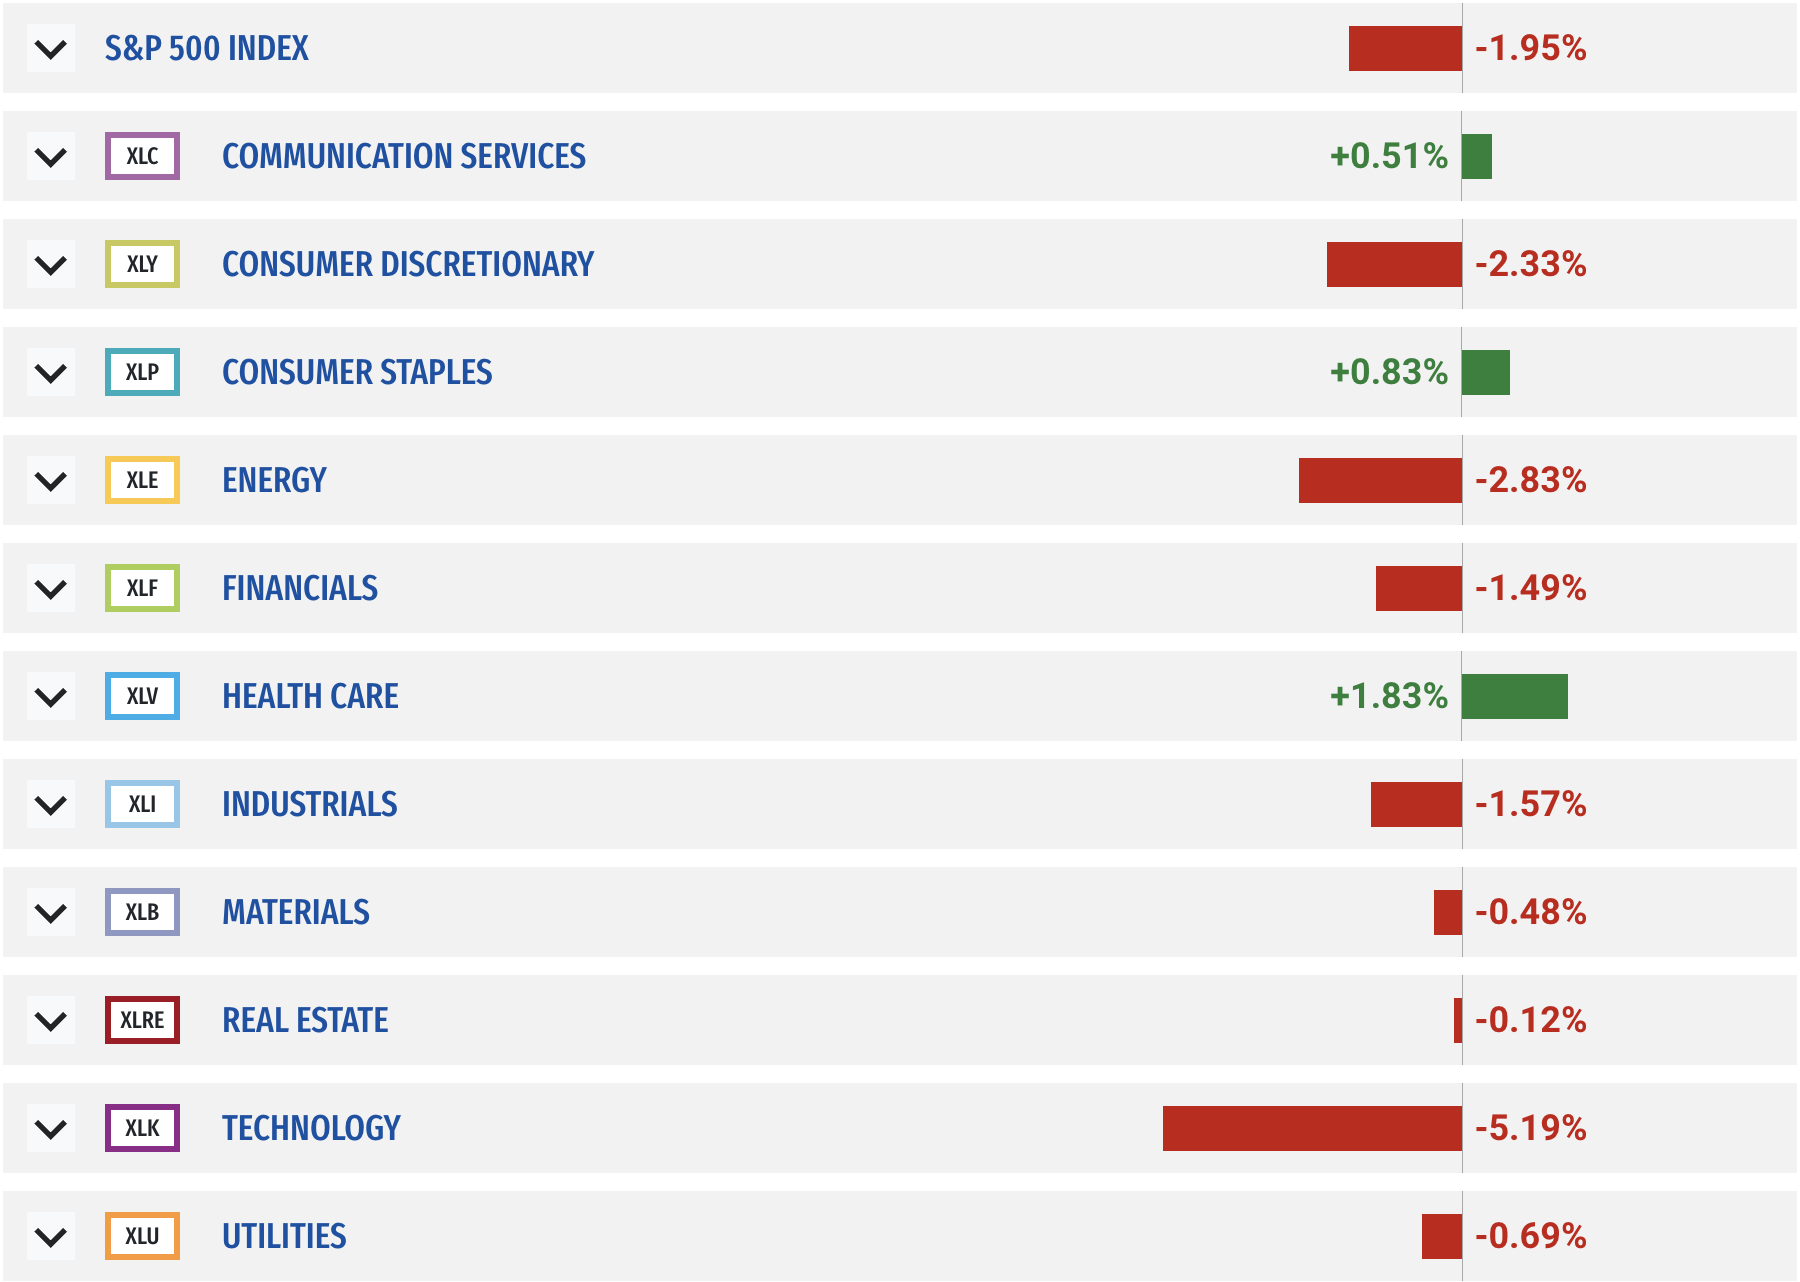
Sector performance was mixed. Technology (XLK) saw the largest decline at –5.19%, followed by Energy (XLE) at –2.83%, Consumer Discretionary (XLY) at –2.33%, and Financials (XLF) at –1.49%. Most other cyclical sectors also finished the week in negative territory.
On the positive side, Health Care (XLV) led all sectors with a +1.83% gain. Consumer Staples (XLP) and Communication Services (XLC) each posted small advances of +0.83% and +0.51%, respectively. Real Estate (XLRE) and Utilities (XLU) were nearly flat, closing slightly lower.
The weekly breakdown shows clear divergence: defensively oriented sectors held up best, while higher-beta and growth-sensitive areas experienced the sharpest pullbacks.
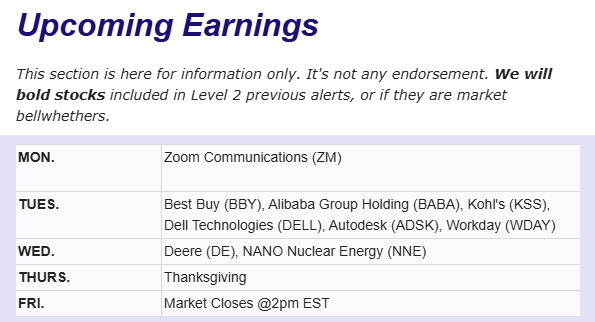
Upcoming Events This Week
A holiday-shortened week in the U.S. will still feature a wave of economic data delayed by the recent federal shutdown. September’s producer prices, retail sales, and durable goods orders are all scheduled for release, alongside key housing-price indexes and regional business surveys.
Internationally, the UK Chancellor will unveil the Autumn Budget, while Germany, France, and Italy publish early readings on November inflation and confidence indicators. Canada and India report updated GDP figures, and the Reserve Bank of New Zealand announces its latest policy decision.
In the U.S., markets close Thursday and shorten Friday. Forecasters expect producer prices to rise 0.3%, retail sales to increase 0.4%, and durable goods orders to edge up 0.2%. Additional U.S. releases include consumer confidence, business inventories, pending home sales, and multiple Fed district surveys.
.png)
Company News
LevelFields AI Stock Alerts Last Week
SNTX Jumps 37% on OTCID Verification and New CEO Appointment
Suntex Enterprises (SNTX) surged 37% after the company announced it achieved OTCID Verified status on OTC Markets and named Javier Leal as its new CEO. The verification milestone and leadership change sparked a wave of speculative buying as traders positioned around potential restructuring and renewed operational visibility.
INR Rises 15% After Strong Q3 Results and Major Buyback
Infinity Natural Resources (INR) climbed 15% following Q3 earnings, updated full-year guidance, and the announcement of a $75 million share repurchase program — roughly 10% of its market cap. The sizable buyback, paired with stronger operational performance, fueled a sharp repricing as investors rotated back into small-cap energy names.

Introducing the LevelFields Portfolio Tracker
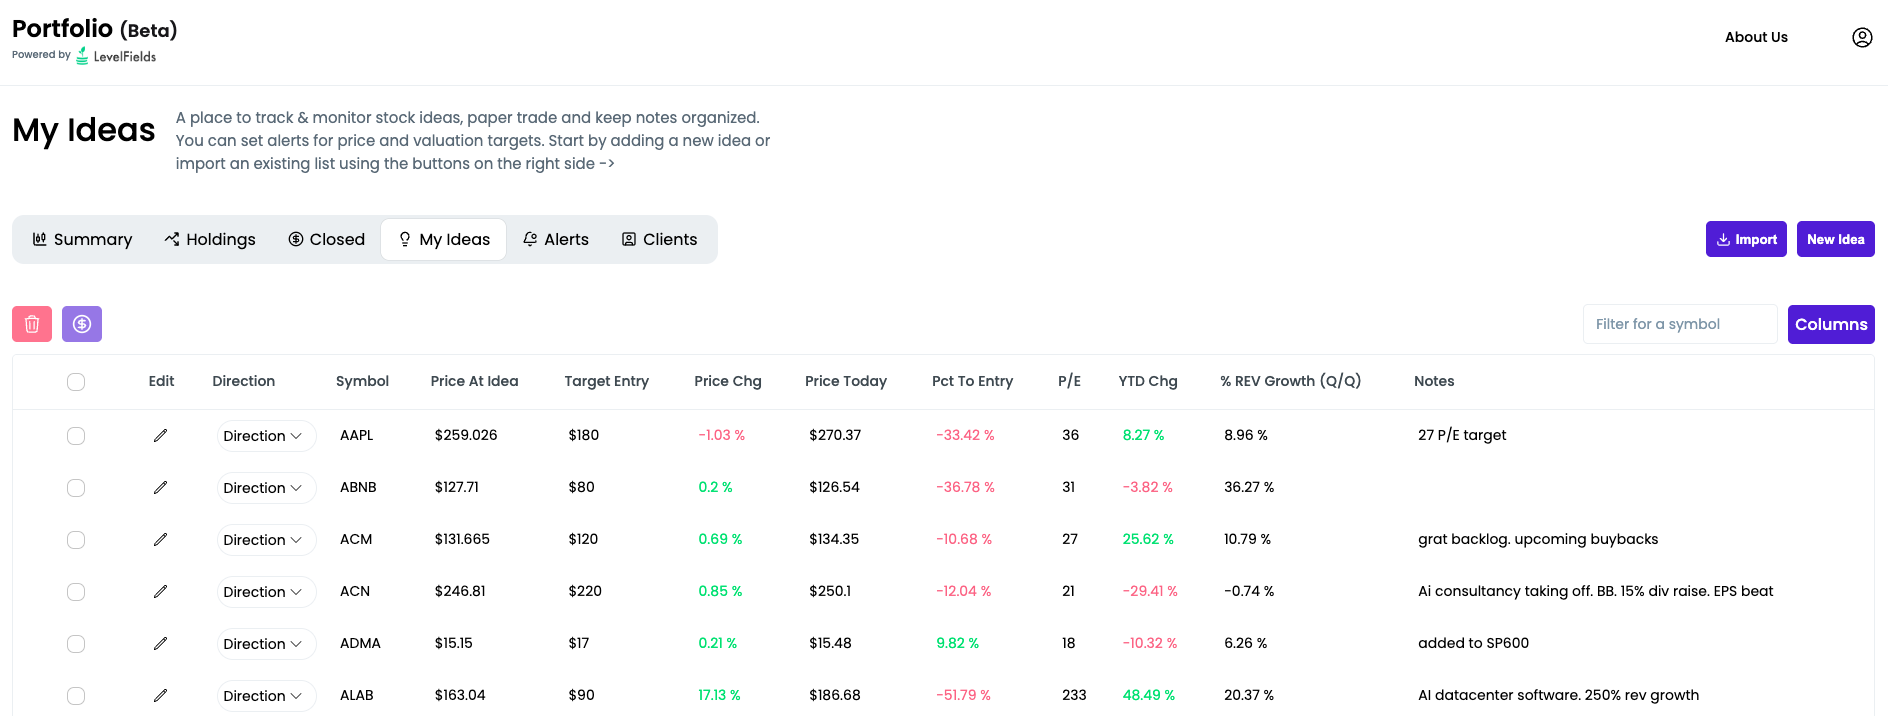
We’ve just launched the new LevelFields Portfolio platform — a centralized dashboard built for active investors and wealth managers to track their trades, organize trade ideas, and monitor real or prospective portfolios.
We've replaced Excel and Google Sheets trade tracking with software that updates as prices and valuations of stocks change, so you don't lose money by missing great entry and exit points.
You can sign up for free!
What it does:
- Lets you add both real positions and idea-stage trades into one unified portfolio.
- Tracks allocation, profit/loss, KPIs, P/E, price targets, and thesis notes in one place.
- Allows you to set real-time alerts on valuation changes, price moves, and price targets using bulk editing (e.g. one alert for all holdings).
- Lets you toggle any ticker between “Idea → Holding → Closed” while preserving the original trade thesis and exit notes.
- Designed for traders, advisors, and fund managers who need a live, organized view of positions + rationale, not just a static spreadsheet of tickers.
- Import CSV file of existing ideas, notes, and portfolio holdings for a quick start
- Keep track of reasons you bought and sold to analyze your performance and for compliance
- Design your own model portfolios based on allocations, sector, and industry


.png)
How to use LevelFields for Options Trading
Tracking Stocks Without Spreadsheets
The Truth About Dividend Stocks
What's LevelFields' Premium Membership Provide?
This is not financial advice. All information represent opinions only for informational purposes. Given the vast number of stocks we cover in these reports, assume staff covering stocks have positions in stocks discussed.
Have feedback or a request for specific data? Drop us a note at support@levelfields.org