


.png)
L2 Weekly Stock Market News Analysis
November 30th, 2025

TLDR:
US stocks finished the week and the month on firmer footing. A post-Thanksgiving rally helped the S&P 500 gain 0.5%, the Nasdaq 0.8%, and the Dow 0.6% on Friday as traders leaned into expectations of a December Fed rate cut, now priced at ~80–85% odds. Risk appetite improved throughout the week, even as a cooling failure at a CME data center briefly froze US futures and added to intraday volatility.
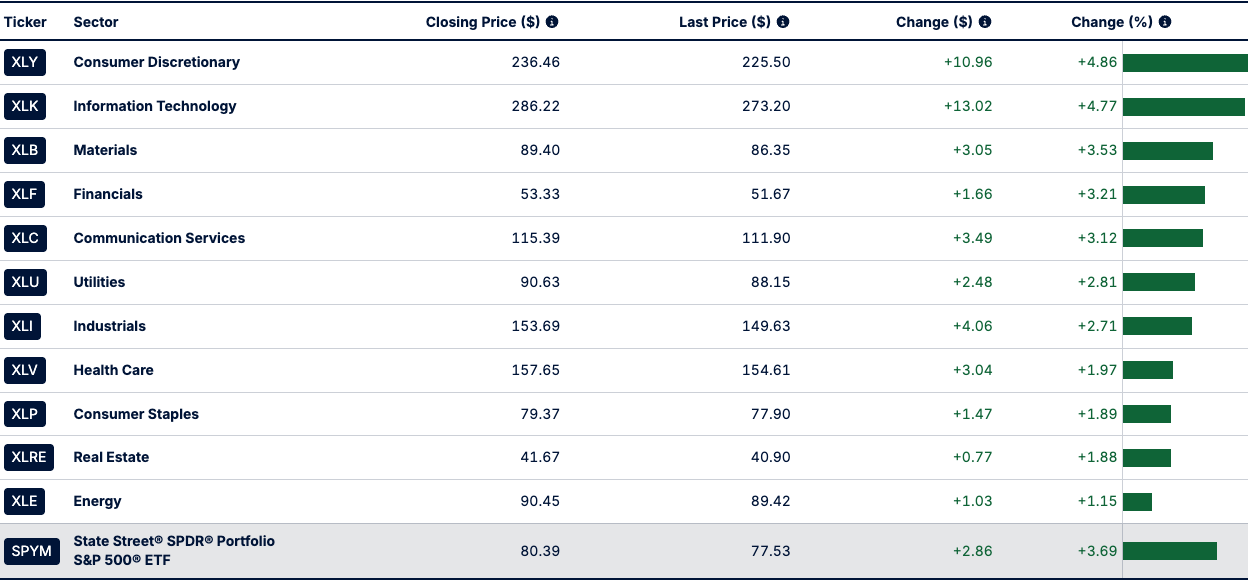
Sector performance was broadly positive. Consumer Discretionary (+4.86%) and Technology (+4.77%) led the market as megacap names bounced from recent weakness. Materials, Financials, and Communication Services posted gains in the +3% range. Defensive groups participated more modestly: Industrials, Health Care, and Utilities rose between +1.9% and +2.8%, while Consumer Staples and Real Estate advanced less than 2%. Energy lagged with a +1.15% move.
Large-cap tech ended the week mixed: Microsoft (+1.3%), Amazon (+1.8%), Meta (+2.3%), Broadcom (+1.4%), and Tesla (+0.8%) advanced, while Nvidia (–1.8%) slipped and Alphabet was flat.
For November overall, the S&P 500 finished roughly flat, the Dow gained 0.3%, and the Nasdaq fell 1.6%, breaking a seven-month streak as investors reassessed stretched AI valuations.
When Markets Went Dark Because the Servers Got Too Hot
Futures for the S&P 500, Treasuries, oil, metals, and farm goods suddenly stopped updating Thursday. Traders around the world stared at screens with frozen prices, unsure if something was breaking underneath the surface.
The cause wasn’t a cyberattack or a financial crisis.
It was a cooling failure.
A major data center in Aurora, Illinois — the facility that runs the electronic engines for CME Group, the world’s largest derivatives exchange — lost the ability to keep its servers cold. As temperatures climbed past safe limits, the machines automatically shut themselves off to avoid permanent damage. When that happened, the majority of U.S. futures trading — the core of global price discovery — went dark.
One overheated room took out the central nervous system of global price discovery.
U.S. data centers already consumed 183 terawatt-hours of electricity last year — more than the entire country of Pakistan. And the curve is steepening fast.
By 2029, data centers are expected to account for around 10% of total U.S. electricity demand, and by 2030, total consumption is projected to more than double from current levels. Every watt becomes heat. Every server needs cooling. Most of these buildings were designed for 2015-level computing, not the far heavier AI loads of 2025.
And it’s already showing up on the ground.
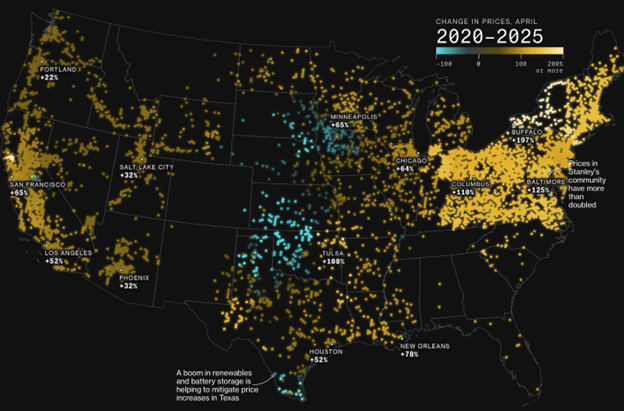
The map below highlights where electricity prices and congestion are rising the fastest — and more than 70% of the nodes with price spikes are located within 50 miles of major data-center activity. This isn’t evenly distributed strain. It’s clustered exactly where AI campuses are multiplying.
This is exactly why we’ve been highlighting Vertiv (VRT) for months. Vertiv builds the cooling and power-management systems that keep data-center racks from cooking themselves. Modern AI clusters run so hot that cooling loops often need to hold temperatures near sub-zero at the cooling point — a process that requires huge amounts of electricity and fresh water. Every AI model, every trading engine, every cloud service depends on this. When cooling fails, everything stacked above it is at risk.
VRT jumped 12% this week, reflecting how essential these behind-the-scenes companies have become. Vertiv was also a past Level 2 trade, and we’ve been writin
g about its importance to the AI build-out long before this outage.
The CME incident made something very clear:
the limits on modern markets aren’t software problems — they’re physical problems: heat, electricity, water, and cooling.
The Pattern Is Bigger Than CME
The CME shutdown wasn’t an isolated event. It’s part of a larger reality: the digital economy is now so stretched that a single failure — in cooling, software, or electricity — can disrupt everything without warning.
We’ve already watched AWS outages knock major apps, payment systems, logistics networks, crypto platforms, and even banks offline because one overloaded data-center cluster malfunctioned. A routine software error at Cloudflare has taken huge portions of the internet down for hours. And across the U.S., 9 of 13 power regions are running “critically tight,” leaving almost no buffer as data-center electricity use accelerates. At the same time, data centers themselves are running hotter, denser, and closer to their thermal ceiling than they were ever designed for — making the entire system more fragile with each new AI build-out.
Different causes, same conclusion:
these failures can happen anywhere, at any moment, and the ripple effects hit immediately.
We’re asking our computers, power grids, and cooling systems to handle far more than they were built for. AI drives electricity demand higher. More electricity creates more heat. More heat strains cooling systems. And when any part of that chain fails, the shockwaves hit the economy immediately.
The physical world — cooling, power, transformers, water, and grid capacity — is becoming the real bottleneck for the digital economy.
The Bottlenecks Beneath the AI Boom
Starting with the basics: AI requires computing power. Compute needs data centers. And data centers are not just “buildings full of servers” — they are industrial complexes made of hundreds of physical components that must all work perfectly, all the time.
Data Centers: The Starting Point of the Bottleneck Chain
Companies like EME (EMCOR) build and wire these facilities — from switchgear rooms and cooling tunnels to backup generators and high-voltage power feeds. Without EPC contractors like EME, new AI campuses simply don’t get built.
AI demand → more data centers → more EMCOR-type construction capacity
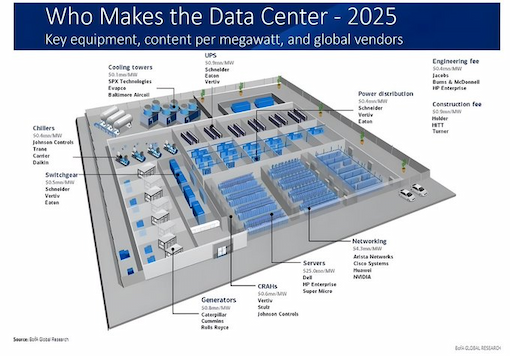
Racks & Servers: Where AI Actually Lives
Inside each data center are tens of thousands of server racks from companies like SMCI (Super Micro) and Dell. These racks integrate GPUs, networking gear, and custom power systems. The more AI model training accelerates, the faster this layer expands.
Racks get denser → more heat → more power → more stress on cooling
Chips & Materials: The Metals Layer
Every server rack is filled with chips made of copper, gallium, germanium, high-grade silicon, and transformer steel.
This is where the strategic materials trade comes in:
- Copper: FCX, TMQ, TGB
- Rare earth magnets: MP
- Antimony (key component in flame-retardant materials used in the construction of electronic equipment, server housings, and wiring within the data center environment itself): UAMY, PPTA
- Lithium (for backup storage): LAC, ALB
- Transformer steel constraints: NUE (grid metals), STLD
Cooling
AI servers run extremely hot. Cooling systems from Vertiv (VRT), Trane (TT), Johnson Controls (JCI), and Stulz keep temperatures from reaching silicon-meltdown levels.
The CME outage proved the point:
When cooling fails, trading stops. When cooling fails at an AI campus, the AI stops.
Water: The Hidden AI Input
Cooling takes enormous amounts of fresh water.
AI queries indirectly consume 1–3 bottles of water per query once you include:
- data-center cooling
- grid-level cooling for the power plants supplying the datacenter
This is why water utilities and water-equipment companies are already raising long-term spending:
- Water utilities: AWK, WTRG, AWR
- Water equipment & metering: XYL, ITRI, BMI
- Engineering & infrastructure: ACM, TTEK, J
AI → more cooling → more water → more water infrastructure capex
This bottleneck is growing faster than most investors realize.

Electricity
Electricity prices are up ~35% since 2020, and Goldman now says 9 of 13 U.S. power regions are already “critically tight.”
AI data centers run 24/7, drawing more power than steel mills.
The utilities who can supply this power — and pass the cost into their rate base — are already preparing for an AI-driven boom:
- Regulated utilities: AEP, SO, DUK, PCG
- Merchant power players: CEG, NRG
The more AI grows, the more power grids stretch to their limits.
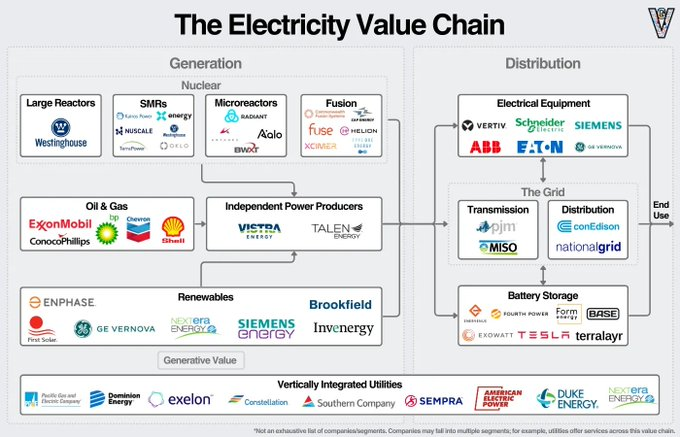
Nuclear
Once you add up water, cooling, and grid strain, the world runs into a simple wall:
There is no way to power AI with existing energy sources.
Gas can’t keep up. Renewables can’t run 24/7.
That’s why nuclear has gone from “long-term idea” to near-term buildout.
Deloitte projects that U.S. data centers could consume: 176 gigawatts by 2035 — more than 5× today’s demand. At that scale, you need round-the-clock, high-density power. Nuclear is one of the few technologies that can realistically deliver that.
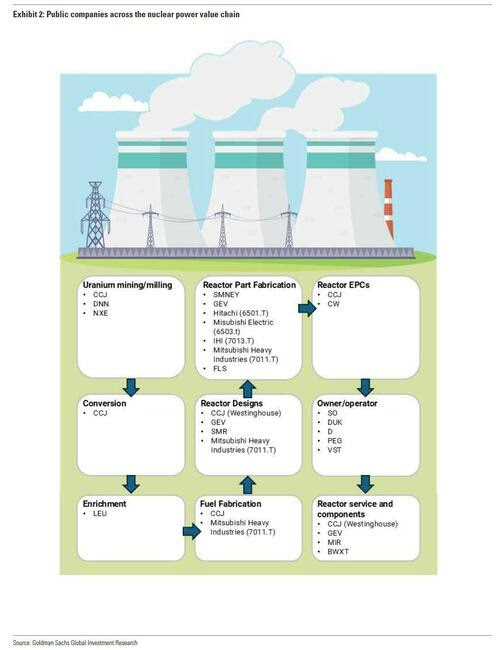
Here’s the full nuclear trade, broken into its parts:
Fuel Supply — Uranium Producers
These are the companies that benefit first as reactors scale:
- CCJ (Cameco) – one of the world’s largest publicly traded uranium suppliers
- UEC, UUUU – U.S. producers positioned for domestic sourcing
- DNN – long-duration resource backing
Enrichment — The Most Critical Chokepoint
44% of global enrichment historically came from Russia.
The U.S. is rebuilding this capacity.
Only one U.S. company is already producing advanced reactor fuel:
- LEU (Centrus Energy) – currently the only U.S. company producing HALEU (high-assay low-enriched uranium) for advanced reactors, under DOE contracts, and a prime beneficiary of U.S. strategic fuel programs.
Reactor Builders — The Companies Making the Hardware
These firms build the SMRs (small modular reactors), next-gen cores, and naval reactors:
- BWXT – DoD reactors + commercial SMR manufacturing
- OKLO – micro-reactors + partnerships with tech companies
Nuclear Operators — The Utilities That Will Sell Power to AI Giants
These companies have nuclear fleets already operating and selling baseload power at premium pricing:
- CEG – largest U.S. nuclear fleet + merchant exposure
- NEE, D – hybrid portfolios with nuclear generation
Construction & EPC — The Builders of the New Nuclear Fleet
When the NRC (U.S. Nuclear Regulatory Commission) approvals accelerate, these are the firms that build:
- FLR, J, ACM, TTEK – major engineering groups benefitting from SMR and reactor construction cycles
Last's Weeks Sector Winners & Losers
Sector performance turned broadly positive this week, with nearly every major group advancing. Consumer Discretionary (XLY) led the market with a +4.86% gain, followed closely by Technology (XLK) at +4.77% as megacap names rebounded from earlier selling pressure. Materials (XLB), Financials (XLF), and Communication Services (XLC) also posted solid moves in the +3% range.
More defensive areas participated but to a lesser degree. Utilities (XLU), Industrials (XLI), and Health Care (XLV) rose between +1.9% and +2.8%, while Consumer Staples (XLP) and Real Estate (XLRE) saw modest gains under +2%. Energy (XLE) lagged the field with only a +1.15% rise.
Upcoming Events This Week
Investors face a busy stretch of delayed economic releases following the government shutdown. The September PCE report is the main focus, with headline PCE expected to accelerate to 2.8% YoY and 0.3% MoM, while core PCE is seen holding at 2.9% YoY. Personal spending likely cooled to 0.4%, and income growth is expected to remain steady at 0.4%.
Fresh readings on the economy will come from the ISM Manufacturing and Services PMIs, which are both projected to show continued softness. The labor picture will get new updates from ADP private payrolls, expected to show only 20,000 new jobs, along with Challenger job-cut data. Industrial production is forecast to rise 0.1%, matching last month’s pace.
Additional U.S. releases include import/export prices, consumer credit, and the final November PMI readings — all offering a clearer look at how tariffs, inflation, and cooling demand are flowing through the economy.
.png)
Company News
LevelFields AI Stock Alerts Last Week
AMBR Jumps 56% on Strong Q3 Results and $50M Buyback
Amber International (AMBR) surged 56% after reporting strong Q3 results and announcing a $50 million share repurchase program—nearly 20% of its market cap. Revenue came in at $16.3M, gross profit at $11.8M, and operating margin flipped to +8%, supported by ~70% YoY growth in client assets and rising institutional/HNW adoption. The buyback, funded through operating cash flow and cash balances, signaled management confidence and triggered heavy speculative inflows.

Introducing the LevelFields Portfolio Tracker
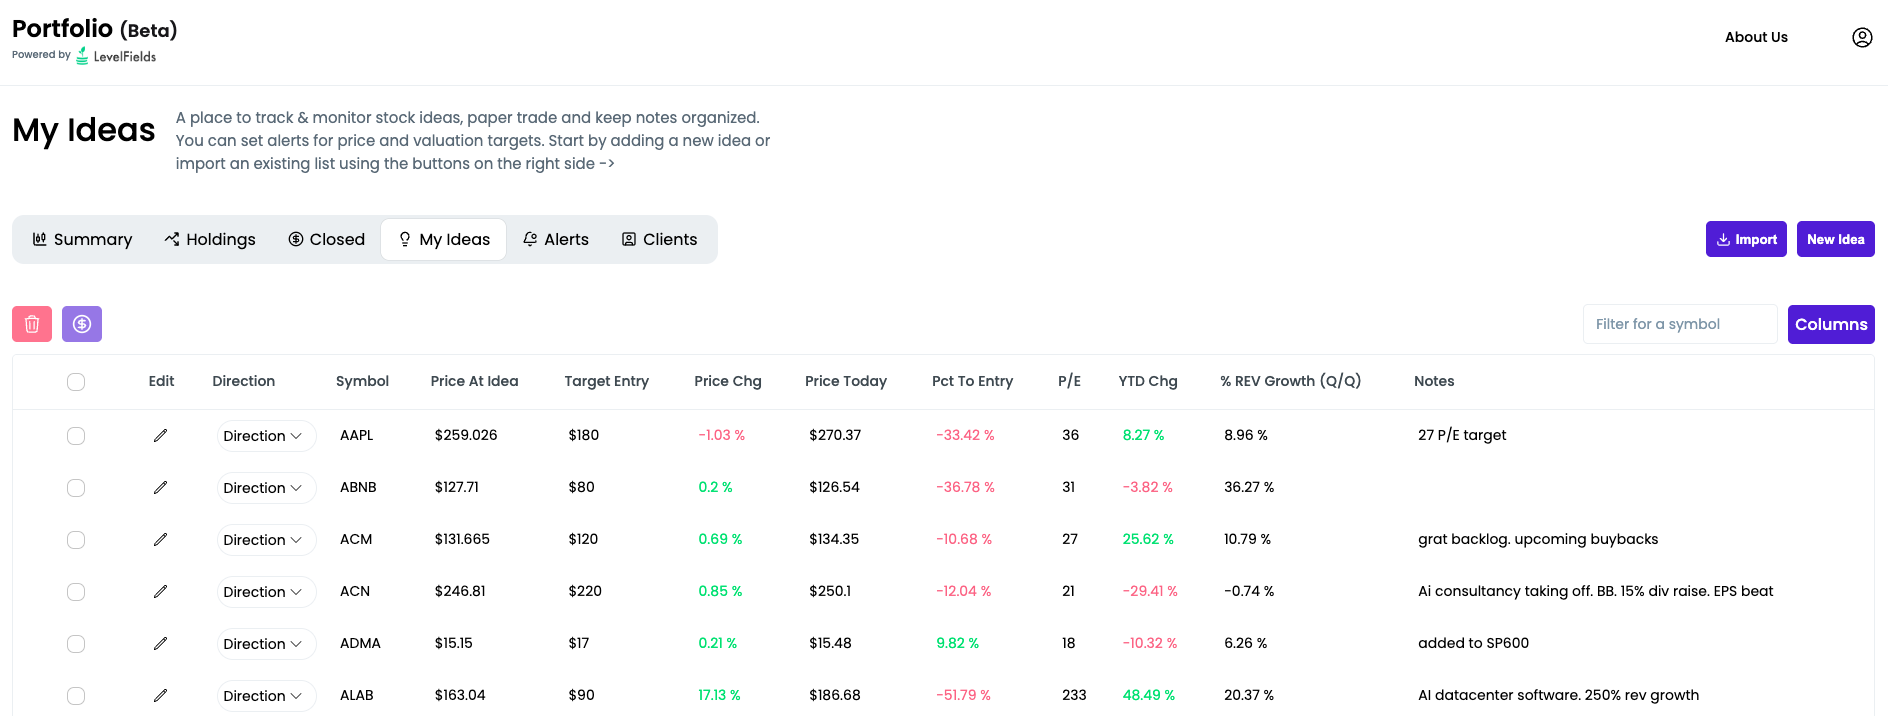
We’ve just launched the new LevelFields Portfolio platform — a centralized dashboard built for active investors and wealth managers to track their trades, organize trade ideas, and monitor real or prospective portfolios.
We've replaced Excel and Google Sheets trade tracking with software that updates as prices and valuations of stocks change, so you don't lose money by missing great entry and exit points.
You can sign up for free!
What it does:
- Lets you add both real positions and idea-stage trades into one unified portfolio.
- Tracks allocation, profit/loss, KPIs, P/E, price targets, and thesis notes in one place.
- Allows you to set real-time alerts on valuation changes, price moves, and price targets using bulk editing (e.g. one alert for all holdings).
- Lets you toggle any ticker between “Idea → Holding → Closed” while preserving the original trade thesis and exit notes.
- Designed for traders, advisors, and fund managers who need a live, organized view of positions + rationale, not just a static spreadsheet of tickers.
- Import CSV file of existing ideas, notes, and portfolio holdings for a quick start
- Keep track of reasons you bought and sold to analyze your performance and for compliance
- Design your own model portfolios based on allocations, sector, and industry
-


.png)
How to use LevelFields for Options Trading
Tracking Stocks Without Spreadsheets
The Truth About Dividend Stocks
What's LevelFields' Premium Membership Provide?
This is not financial advice. All information represent opinions only for informational purposes. Given the vast number of stocks we cover in these reports, assume staff covering stocks have positions in stocks discussed.
Have feedback or a request for specific data? Drop us a note at support@levelfields.org